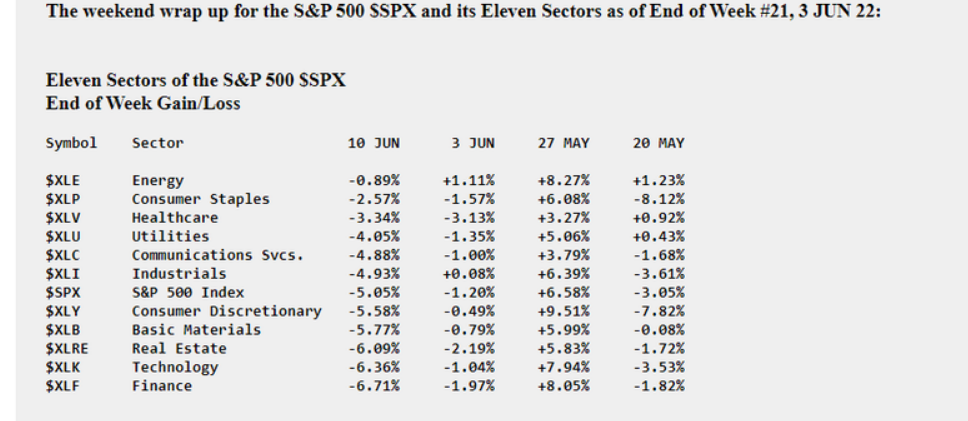
Final heat map of the S&P 500's performance from this past week pic.twitter.com/g5NInHZR9e
— Stock Market News (@StockMKTNewz) June 11, 2022
Top 25 S&P 500 list was down 2.66% this week as selling picked up across the market$SPY $SPX @Stocktwits pic.twitter.com/j7exj9uMNk
— Sniper Trades (@SnipeTrades) June 12, 2022
The last time Nasdaq 100 broke its 200 Week Moving Average was in Aug 2008 at the start of Great Financial Crisis
We are ~4% away from the 200 Week EMA on Nasdaq 100 today
Aaar ya Paar#NDX100 pic.twitter.com/t0MvaVIUnc
— Tar ⚡ (@itsTarH) June 12, 2022


It wouldn’t be irrational for S&P 500 2022 margin expectations to contract from the 16.8% currently projected. But, contraction in expectations does not mean there will be a contraction in actual results. #spx500 #spx #SP500 #DowJones #WallStreet #wallstreetbets pic.twitter.com/Y9FNsDF4R1
— #VIDITGUPTA (@VIDITGUPTA) June 12, 2022
Interesting from Bloomberg Intelligence… S&P 500 PE gone from 31.6x a year ago to 16.3x (trailing) currently. Equivalent multiple compression took >3 years in internet bubble burst. Now 17% of the SP500 trades at single digit fwd PE (was 33% at bottom in March 20 and 24% Q4 18) pic.twitter.com/HGUhh9lYVg
— LeftHandedOctopus (@AggieCapitalist) June 7, 2022
RJ: There has been a strong 86% inverse correlation between S&P 500 forward P/E multiples and the US 10-year (inverted below) Treasury yield over the past year.
Should rates continue to rise, multiples are likely to compress further — and vice versa. pic.twitter.com/u5XQQrqDeZ
— Markets & Mayhem (@Mayhem4Markets) June 12, 2022
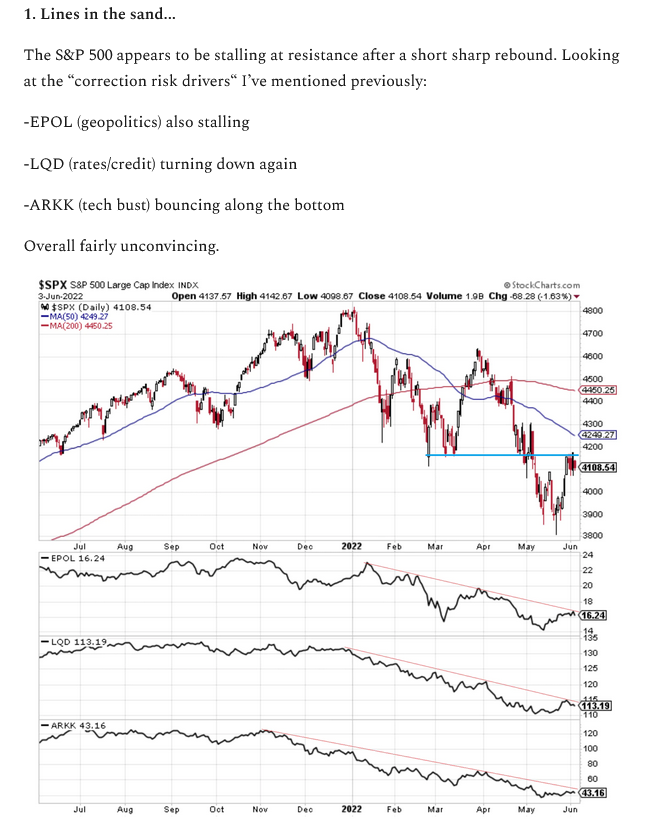
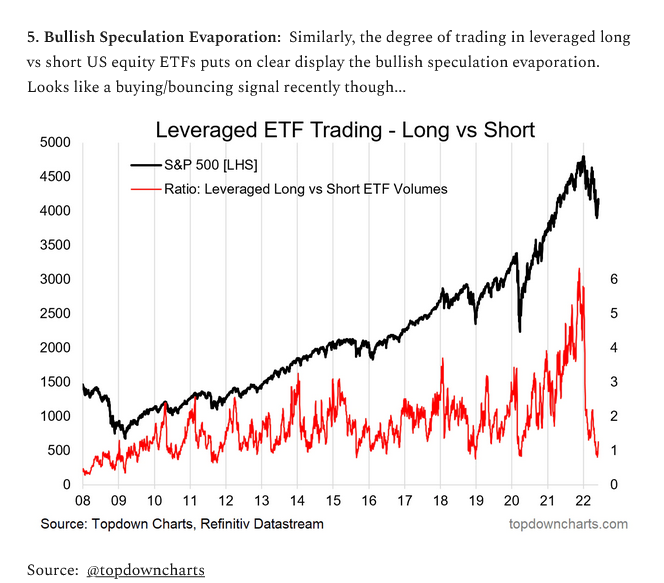
Weekly S&P500 ChartStorm – 12 June 2022
by @Callum_Thomas @topdowncharts https://t.co/lTJxyIAlPM
Of the 12 great charts this week, this is my favorite:
(Source: @WillieDelwiche) pic.twitter.com/OwhCY8tE32— John Lounsbury (@jlounsbury59) June 12, 2022
"Relative to price, S&P 500 pays out just under 5% in earnings as of Thursday, versus the 4.4% average yield on investment-grade corporate bonds. The 0.54% difference is the close to the slimmest advantage that equities have held over credit since 2010." https://t.co/YUK3a6O4Ac
— Tren Griffin (@trengriffin) June 12, 2022
$SPY 4 rallies of 7% or greater this year
YTD -17.91%The sum of the declines is greater than the sum of the rallies. Definition of downtrend
see the video for more https://t.co/lpUUS9j4rN pic.twitter.com/7eIWoFnBjM
— Brian Shannon, CMT (@alphatrends) June 11, 2022
Stock market flashes bearish signals. The Nasdaq closed below the low of its follow-through day while the S&P 500 set a 14-month closing low. The action of leading stocks? Even worse. (1/3)https://t.co/gEsT2inoRp $NTES $ALB $NOC $ON $LLY $TSLA pic.twitter.com/RaPoK3oGW6
— Ed Carson (@IBD_ECarson) June 11, 2022
I know it seems too simple, but I avoided all of the large market down-trends since 2000 with a few rules like those in the chart. I also look at whether the 30 week average is rising or falling. Here is SP500 at the recent top and the 2000 top and bottom in 2003. pic.twitter.com/vvMPZoM0kV
— Dr. Eric Wish (@WishingWealth) June 10, 2022
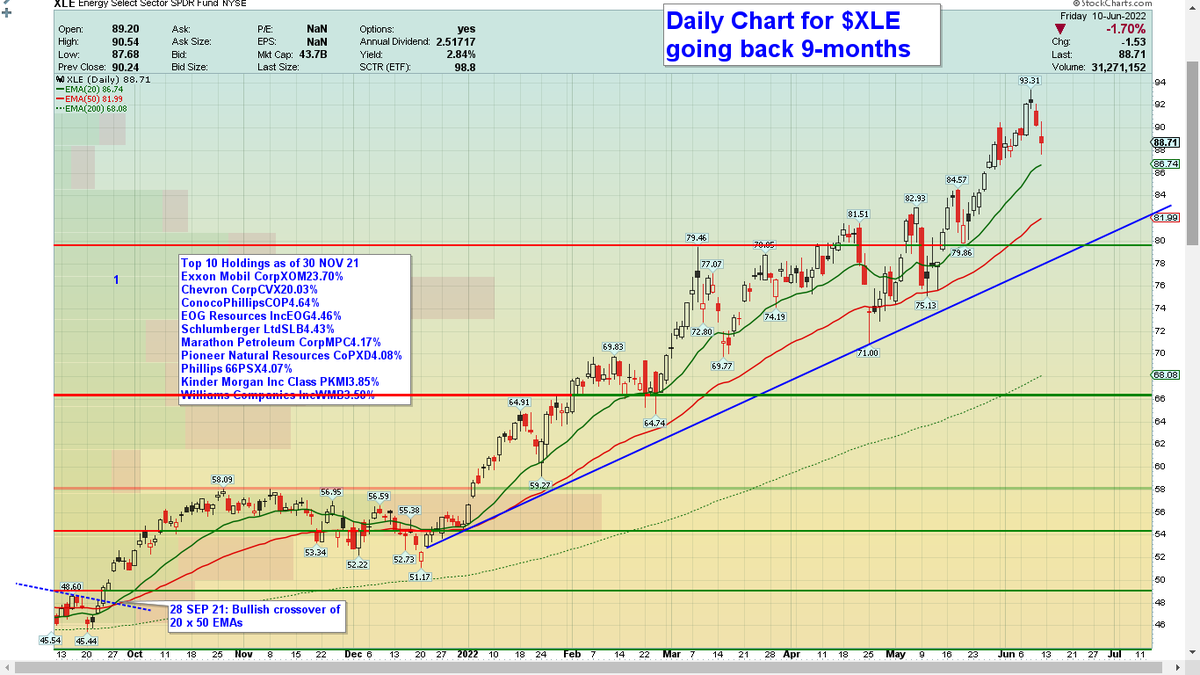
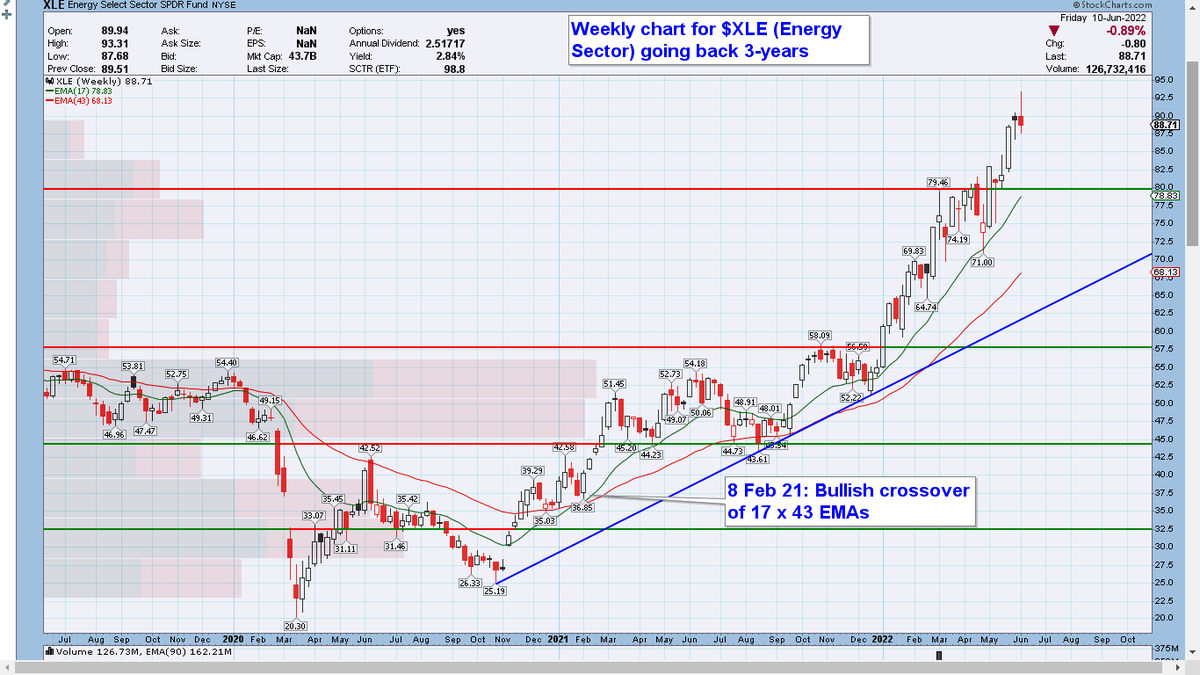
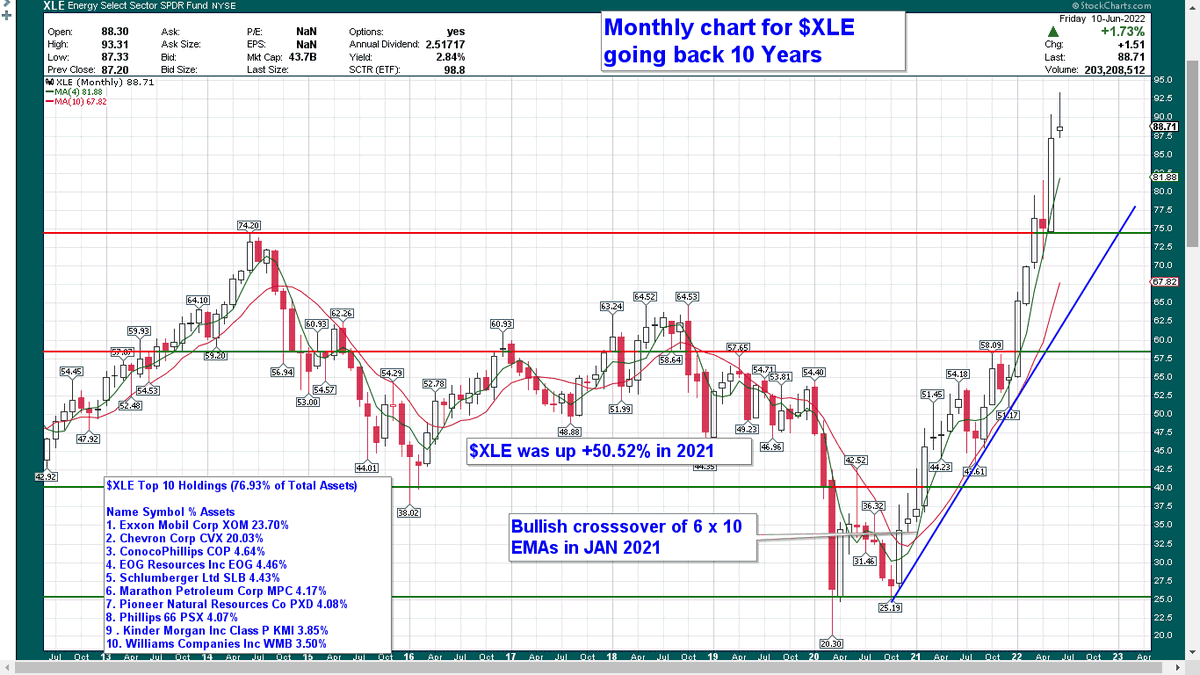
Energy is now 4.8% of the market cap of the S&P500– still well below its 13% mark immediately after the Great Financial Crisis. Small-cap energy is 8.8% of the Russell 2000, above the prior cycle's high. pic.twitter.com/Md1648C11P
— Gina Martin Adams (@GinaMartinAdams) June 7, 2022