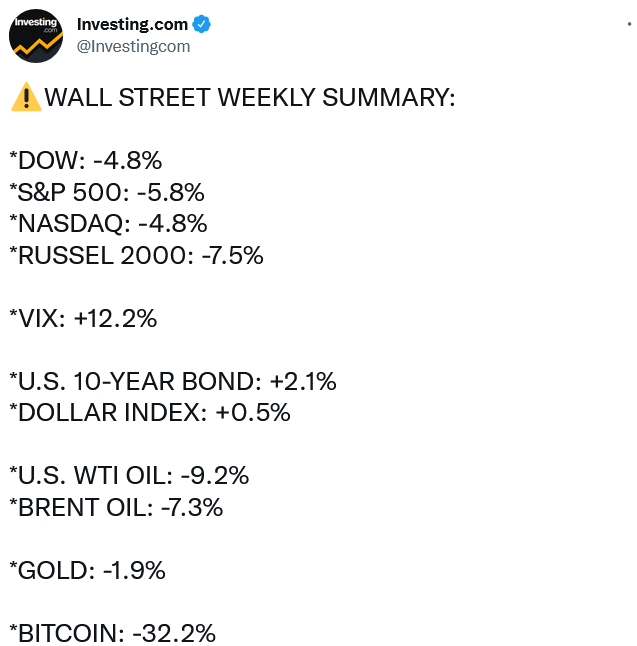
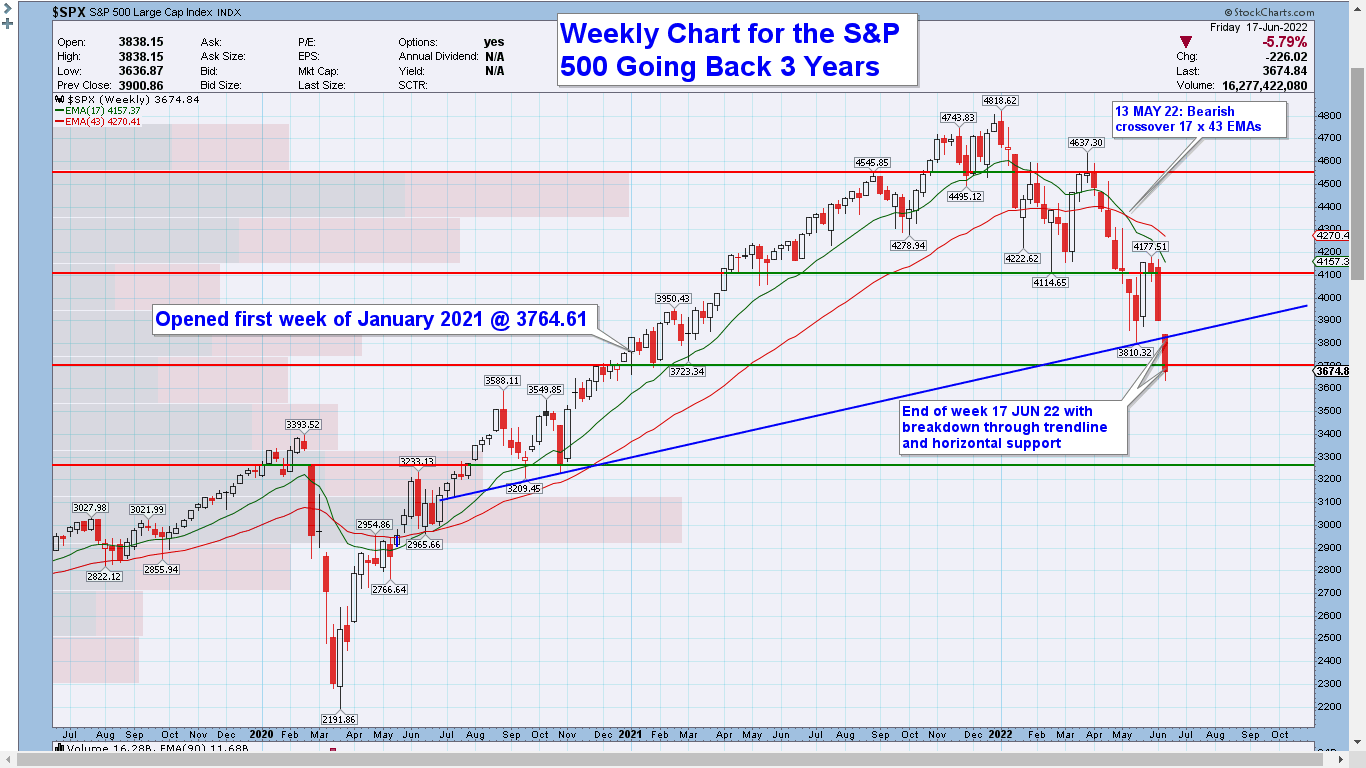
The S&P 500 ends the week down 5.8%, its biggest plunge since March 2020 https://t.co/Z4SLCmmRmf pic.twitter.com/0wOZ7ZVezc
— Bloomberg (@business) June 17, 2022
The S&P 500 is about to down down 10 out of the past 11 weeks.
That has only happened once in history and it was in 1970.
— Ryan Detrick, CMT (@RyanDetrick) June 17, 2022
https://twitter.com/peregreine/status/1538383439459647488/photo/1
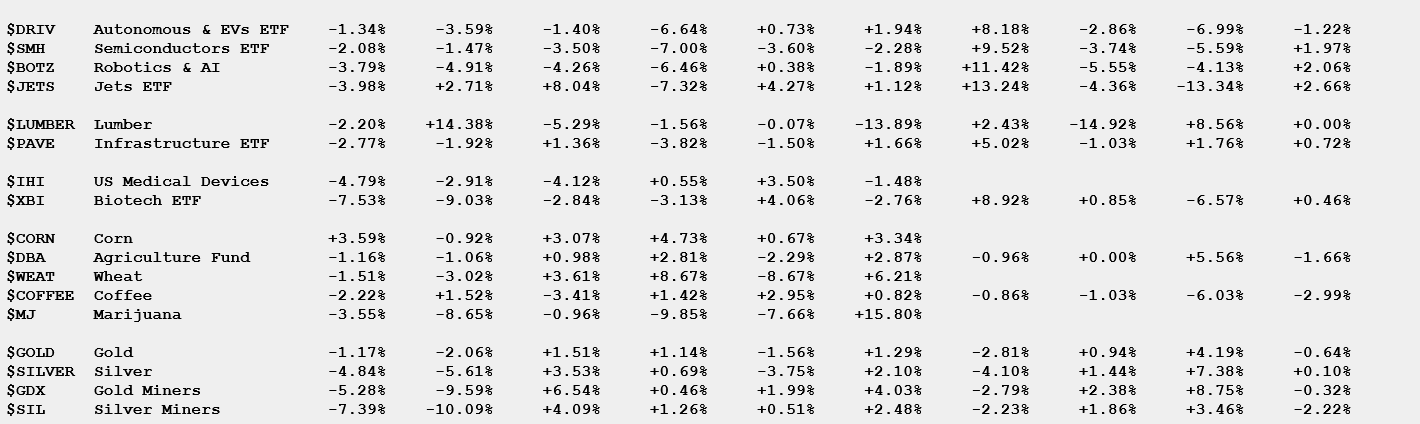
Final heat map of the S&P 500's performance from this past week pic.twitter.com/OuvGyMoJ4w
— Stock Market News (@StockMKTNewz) June 18, 2022


% of S&P 500 Stocks Above 50-Day Moving Average:
2.2% $SPY pic.twitter.com/BdA1bpJxJZ
— Mike Zaccardi, CFA, CMT (@MikeZaccardi) June 18, 2022
Updated: the percent of S&P 500 stocks trading above their 200-day moving average (SMA) ended the week around 13%. This metric has gotten as low as 3.21% in 2020, and 1% in 2009.$SPY $SPX #StockMarket ☕ pic.twitter.com/I30prvAJRX
— Jack Damn (@JackDamn) June 18, 2022
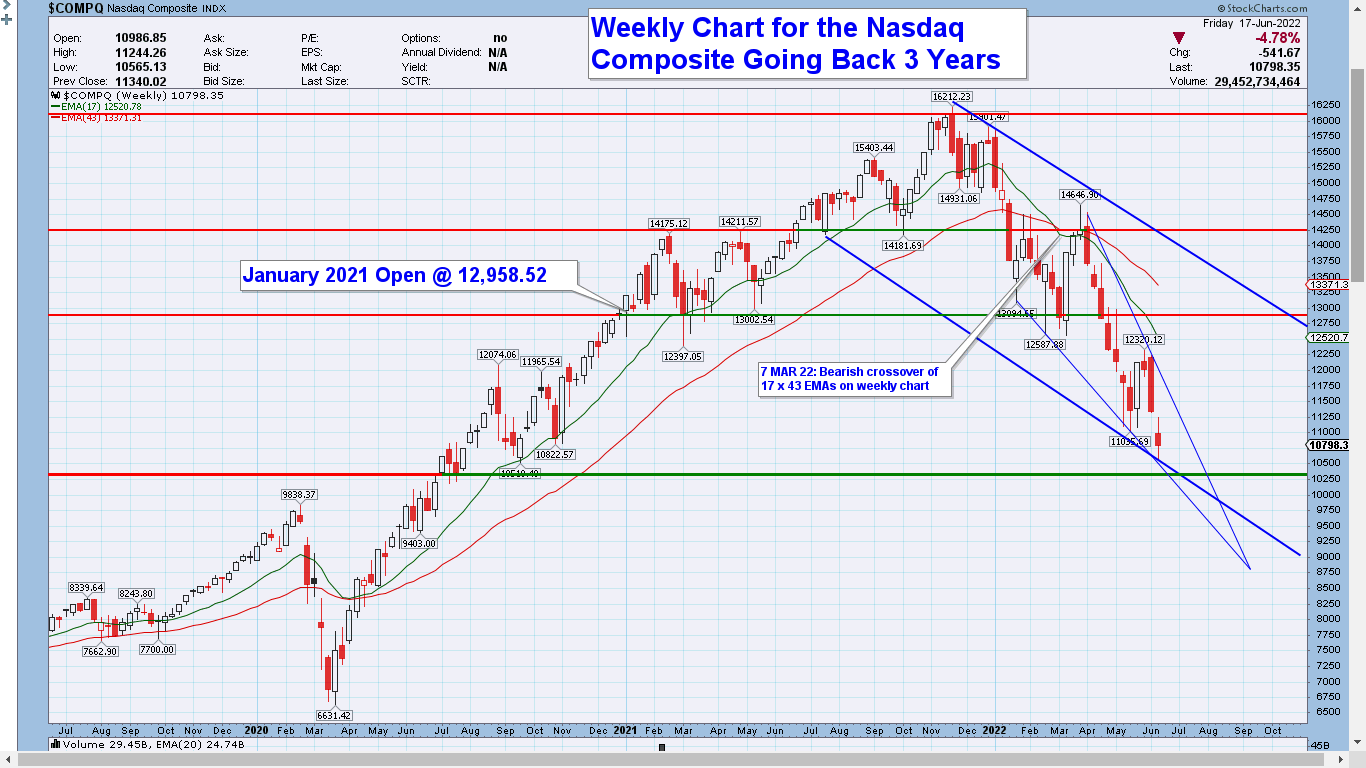
You can't always look to historic trends to predict future price movement in markets.
Under similar market conditions the market may move in the same manner.
You can however see the #NASDAQ over the past 3 years, has moved in a very similar fashion as it did between 1998 to 2002. pic.twitter.com/NNyh8M0wWh— Sim (@IronCondorWheel) June 18, 2022
Pretty stunning. Net #bullish #sentiment on our composite index of retail and institutional investors is now at #Financial #Crisis lows. #Contrarian indicator. pic.twitter.com/b9jgBblXon
— Lance Roberts (@LanceRoberts) June 18, 2022
1/2
YTD S&P 500 PRICE return for every year back to 1926.
Blue=2022
Green=best
Red=worstThrough June 17, S&P -22.91%.
Only 1932 was worse through this point. 1962 is close.If the year were to end here, it would be the 7th worst.
No one has seen anything like this year. pic.twitter.com/otD55T2KjO
— Jim Bianco biancoresearch.eth (@biancoresearch) June 18, 2022
More than 90% of stocks in the S&P 500 declined today.
It's the 5th time in the past 7 days.
Since 1928, there have been exactly 0 precedents. This is the most overwhelming display of selling in history.
— Jason Goepfert (@jasongoepfert) June 16, 2022
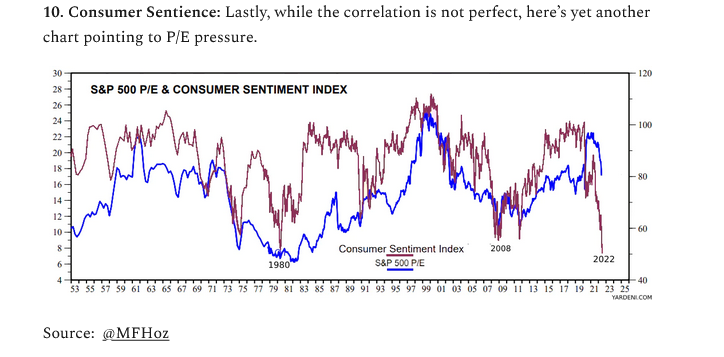
S&P 500 trailing P/E ratio is 17.0,
which is below the 5-year average of 23.0 and below the 10-year average of 20.3. pic.twitter.com/XNoSJzPXtk
— Mike Zaccardi, CFA, CMT (@MikeZaccardi) June 17, 2022
40% of stocks in the S&P 500 are at a 52-week low.
Investors are panic selling, but that doesn't mean a bottom is imminent. https://t.co/djBdCmdQoS pic.twitter.com/3225y8njKH
— Michael Batnick (@michaelbatnick) June 17, 2022
This is the 3rd worst start to a year in history for the S&P 500, down 23% in the first 115 trading days. pic.twitter.com/hvhgtE9F8E
— Charlie Bilello (@charliebilello) June 16, 2022
Big 5 are losing their shine … 5 largest stocks in S&P 500 have seen their collective weight (market cap as % of overall index) drop sharply this year pic.twitter.com/FIq0OKQMd2
— Liz Ann Sonders (@LizAnnSonders) June 17, 2022
A 60/40 Portfolio of the S&P 500 and 10-Year Treasury Bond is down 15.7% year-to-date, on pace for its worst year since 1937.
Top 5 annual declines for US 60/40…
1) 1931: -27.3%
2) 1937: -20.7%
3) 1974: -14.7%
4) 2008: -13.9%
5) 1930: -13.3% pic.twitter.com/P74uFZito0— Charlie Bilello (@charliebilello) June 12, 2022
Updated: the percent of S&P 500 stocks trading above their 200-day moving average (SMA) ended the week around 13%. This metric has gotten as low as 3.21% in 2020, and 1% in 2009.$SPY $SPX #StockMarket ☕ pic.twitter.com/I30prvAJRX
— Jack Damn (@JackDamn) June 18, 2022
Scores of newly public companies worth less than they raised from #VC'shttps://t.co/BpJEvq30bk
Newly public companies have performed far worse than the broader market. PitchBook's index of VC-backed IPOs has declined 57.7% this year, versus 24% for the S&P 500. pic.twitter.com/1XYXUUyRAe— Dennis Moore (@dbmoore) June 18, 2022
🇺🇸 Earnings
Morgan Stanley expects S&P 500 earnings per share of $225 in 2022 and $236 in 2023
👉 https://t.co/3SVJ18RESnh/t @MorganStanley #markets #investing #earnings #EPS#sp500 $spx #spx $spy #stocks #stockmarket #equities pic.twitter.com/ZAgkj6dxsv
— ISABELNET (@ISABELNET_SA) June 18, 2022
Annual S&P 500 EPS trend history
2022 & 2023 on the increase pic.twitter.com/xDwubTLu4V
— Mike Zaccardi, CFA, CMT (@MikeZaccardi) June 17, 2022
S&P 500 PE ratio 70s: ~7X
S&P 500 PE ratio now: ~18XIf the 70s stagflation is what you think is coming, then we have a long way down by this indicator.
— Snir David (long term investing) (@snird) June 18, 2022
I think 2020s profit margins for S&P 500 (and akin parts of the world) will be akin to the 2010s…just not getting higher and higher. As all investors should know, you have got to pick-and-choose investments carefully pic.twitter.com/kINhN5nOqj
— Chris Bailey (@Financial_Orbit) June 18, 2022
In 2008, the S&P 500's entry into a bear market heralded the peak of oil prices just days later.
Over the next 5 months oil lost 77.5% of its value.
There are hopes that today's large drops in oil prices are the beginning of history repeating itself. pic.twitter.com/iylIxBbkMu
— Avid Commentator 🇦🇺 (@AvidCommentator) June 17, 2022
This has been a remarkably typical beginning to a bear market. In fact, it required 111 trading days for the S&P 500 Index to lose -20% and fall into formal bear market status – just 17 days shorter than the median…
— Sam H. Fawaz, CPA, CFP®, PFS (@TheMoneyGeek) June 18, 2022
Consumer Discretionary stocks relative to the S&P 500 is at the Covid Crash lows. pic.twitter.com/TU10xHTy62
— Michael A. Gayed, CFA (@leadlagreport) June 18, 2022
Energy sector continues to trade at quite a significant discount relative to S&P 500 (using forward P/E) pic.twitter.com/7OyFMne0Fb
— Liz Ann Sonders (@LizAnnSonders) June 17, 2022
Weekly Flow data update (BAML):
– Equities: $16.6bn inflows. AGAIN
– Bonds: $18.5bn outflows“For every $100 inflows since Jan 2020 there’s been … $0 outflows from equities”
🙈🙈🙈🙈🙈🙈🙈🙈🙈🙈🙈🙈
NO CAPITULATION!!! @gnoble79 https://t.co/wlBAiUWt92— Le Shrub 🔥🌳🇺🇦 (@agnostoxxx) June 17, 2022
Six straight weeks of equity inflows.
Another $14.8 billion.@business https://t.co/6h5bEJXnHw
— Carl Quintanilla (@carlquintanilla) June 17, 2022
Household balance sheets remain strong due to rapid asset price appreciation and a high saving rate during the pandemic despite the recent pullback in equity prices.
Goldman pic.twitter.com/eUU1vRH7c8
— Mike Zaccardi, CFA, CMT (@MikeZaccardi) June 18, 2022
Deutsche Bank: Equity fund flows have remained really strong so far despite the market selloff $SPY pic.twitter.com/BdHzlg5iGE
— BAIL, BOOZE, BUFFALO BILLS (@stockmarketale3) June 18, 2022
Equity flows across regions – @SoberLook @DeutscheBank pic.twitter.com/W9K1KOyDyf
— Rob Hager (@Rob_Hager) June 16, 2022
“QUICK CLIENT POLL,” from JPMorgan desk:
“What level would you feel comfortable buying SPX right now, and why? ..
“Responses were wide ranging: 2000 – 3500, the average was 3060 – while the median was 3200 ..”
— Carl Quintanilla (@carlquintanilla) June 17, 2022
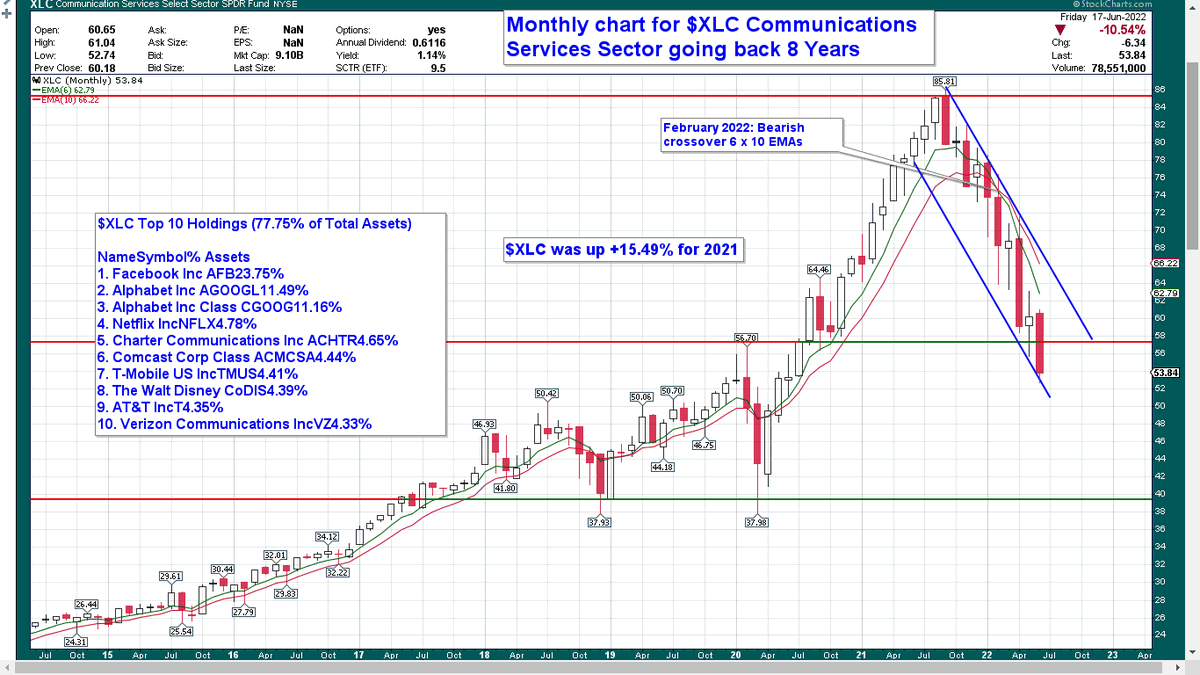
To paraphrase one of my favorite technicians, John Roque: This is a reversion BEYOND the mean business! The below outlines how far the S&P 500 Communication Svcs sector index is trading from its 100-week SMA.$SPTS $SPX pic.twitter.com/gCCilyyoNc
— Shane C. Murphy, CMT (@murphycharts) June 18, 2022
Since 2011, the S&P 500 achieved a return of 337% (CAGR: 14.3%). The return consisted of the following components:
– Multiple expansion: 14.4%
– Profit growth: 40.5%
– Dividends: 7.4%
– Share buybacks: 37.7%Only when undervalued do share buybacks create value. pic.twitter.com/bE5gbMvqRk
— Quality Compounding (@QCompounding) June 18, 2022
Historically, nominal S&P 500 earnings have been rather flat through inflation spikes more often than not, as rising expenses eat into rising revenues. https://t.co/dWjfihrH4t
— Lyn Alden (@LynAldenContact) June 18, 2022
On average, bear markets have lasted for 40 weeks:
(S&P500 data) pic.twitter.com/AWeWTuTNL5
— Quality Compounding (@QCompounding) June 15, 2022
This market is oversold and due for a rally.
But DO NOT go thinking it is “undervalued.”
Shiller PE is at 28.39. To get back to:
LT average + 1 Std. Dev (25.4) = SPX (-10%)
LT average = SPX -39% (17.4) = SPX (-39%)
LT average – 1 Std. Dev (9.5) = SPX (-67%) pic.twitter.com/IjyIE8wKfV— Jay Kaeppel (@jaykaeppel) June 18, 2022
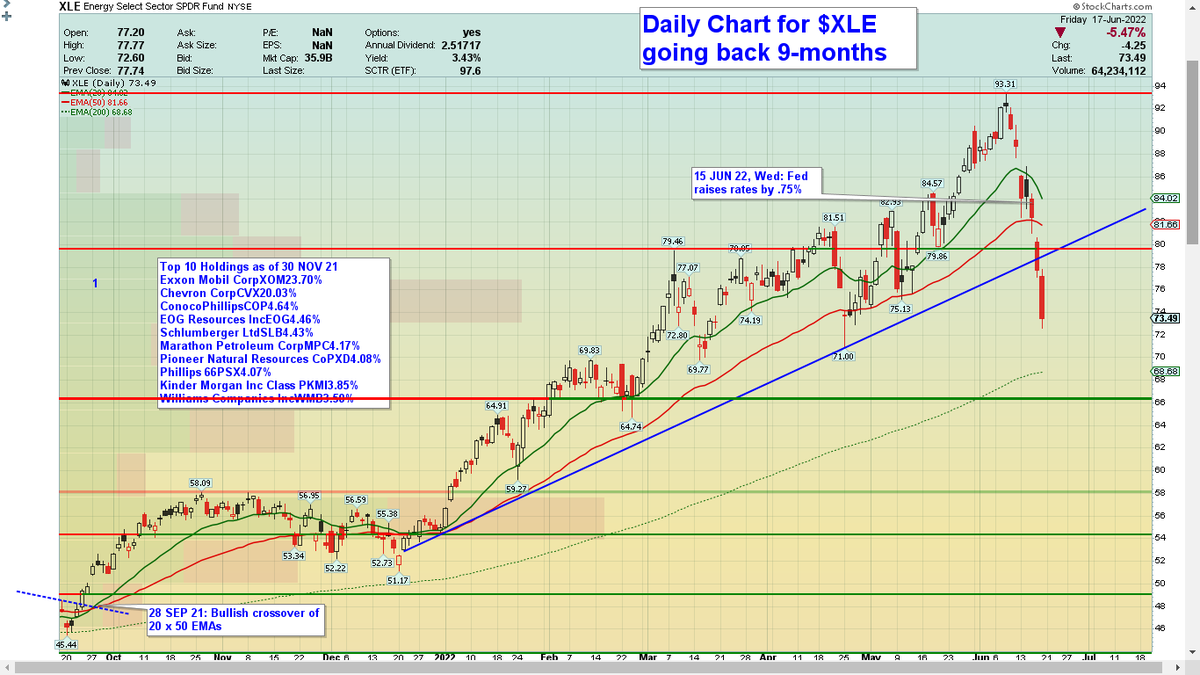
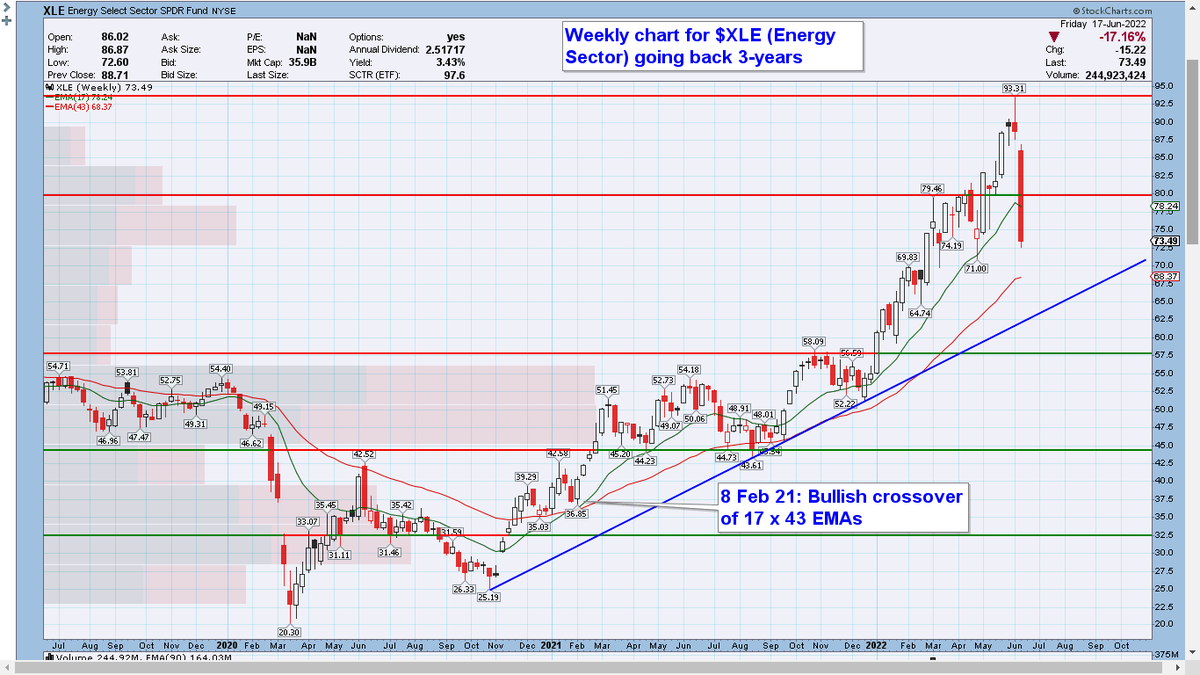
Energy sector bullish percent index went from near 100% two weeks ago to just 9.5% now. $XLE
The Bullish Percent Index, or BPI, is a breadth indicator that shows the percentage of stocks on Point & Figure Buy Signals. pic.twitter.com/W4YcZFmIJV
— Mike Zaccardi, CFA, CMT (@MikeZaccardi) June 18, 2022
#NDX, quarterly
2000 vs 2022
Compare the current quarterly NDX candle with the one printed in 2000. Well, guess what, NDX dropped additional 60% during the next 2 years after that quarter was over.
I wonder how many fintwit accounts will steal this one 🙂 pic.twitter.com/JdGSb2DY6a
— Yuriy Matso (@yuriymatso) June 19, 2022
The buyer's strike continues…
Asset Managers own the lowest level of S&P futures since '16 pic.twitter.com/NtFxskoYs4
— Christian Fromhertz 🇺🇸🇺🇦 (@cfromhertz) June 18, 2022
"This year's free fall in the S&P 500 forward P/E was preceded by even greater free falls from around 20.0 at the beginning of 2021 for the S&P 400 MidCaps down to 11.1 on Friday and to 10.8 for the S&P 600 SmallCaps." – Yardeni Reserach
The Small & Mid Cap levels are troubling pic.twitter.com/XC67yPRRYh
— Ayesha Tariq, CFA (@ayeshatariq) June 19, 2022
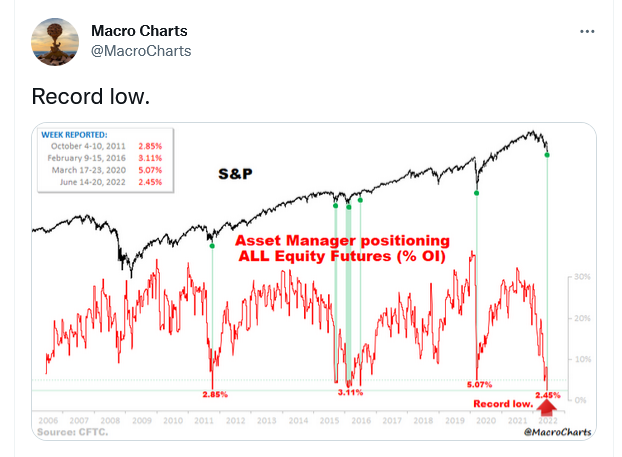
Long positioning in the S&P 500 Index futures is at a record low, this is generally a contrarian indicator at the extremes, a possible sharp bear market rally may come in the coming week.
Corporate insider selling in the Energy sector (XLE) is going through the roof and is at a level unseen for over a decade.
You know what that means… pic.twitter.com/rqyWLKPFzW— Game of Trades (@GameofTrades_) June 10, 2022
Energy bullish percent index is the lowest since Oct 2020 $XLE pic.twitter.com/TiWqRHeVt5
— Mike Zaccardi, CFA, CMT (@MikeZaccardi) June 18, 2022