Final heat map of the S&P 500's performance from this past week pic.twitter.com/WaGJoZTZys
— Ritvik Bhanot (@ritvikbhanot1) July 31, 2022
The S&P500 (+9.1%) $SPX and Dow Jones (+6.7%) $DJIA indices both recorded their best monthly gain since November 2020. The #NASDAQ (+12.3%) handed down its best monthly performance since April 2020. For the first time this year, all sectors of the S&P500 index improved.
— CommSec (@CommSec) July 30, 2022
▪️ Individual investors continue to pour into the market at record levels. ~$25b a month through 2022.
▪️ Compared to 2018-2020 when the number was closer to $3-5b $SPX $QQQ
▪️ $JPM says institutional investors have removed $258b through July 5 this yr pic.twitter.com/1IHQbfaRnM
— Rahul (@rhemrajani9) July 30, 2022
$SPX companies with more international exposure are reporting higher revenue growth than $SPX companies with more domestic exposure for Q2. #earnings, #earningsinsight, https://t.co/KNFhlTHfiO pic.twitter.com/0ZHKgaqi7o
— FactSet (@FactSet) July 25, 2022
$SPX companies with more international exposure are reporting higher earnings growth than $SPX companies with more domestic exposure for Q2. #earnings, #earningsinsight, https://t.co/KNFhlTHfiO pic.twitter.com/ok96Y1Irls
— FactSet (@FactSet) July 25, 2022
73% of $SPX companies have beaten EPS estimates to date for Q2 2022, which is the lowest % since Q1 2020 (63%). #earnings, #earningsinsight, https://t.co/JPtxD3TCnj pic.twitter.com/AhlDDXdvNP
— FactSet (@FactSet) July 29, 2022
$SPX is reporting Y/Y earnings growth of 6.0% for Q2 2022, which is the lowest growth since Q4 2020 (4.0%). #earnings, #earningsinsight, https://t.co/JPtxD3TCnj pic.twitter.com/TT8VCyk52i
— FactSet (@FactSet) July 30, 2022
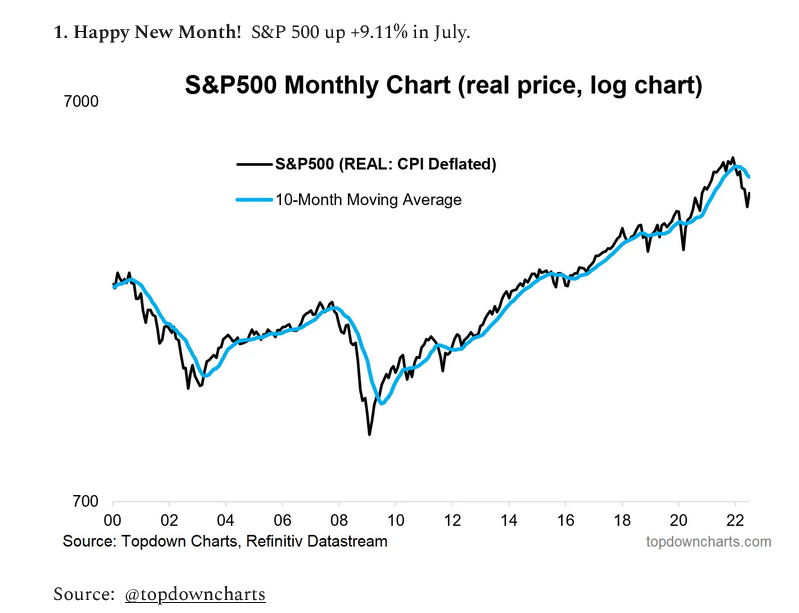
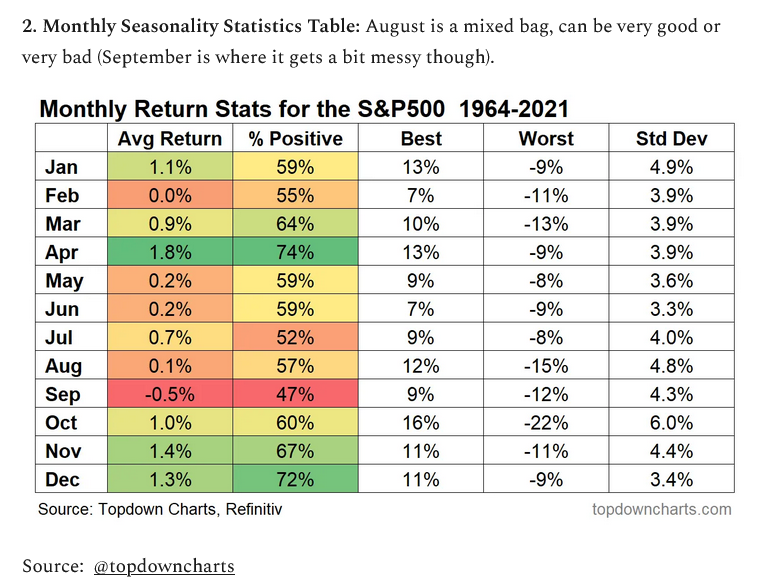
The S&P 500's 9.11% return in July was good for the 3rd best July ever. Only 1939 and 1932 were better.
When July is up at least 5%, August and September show stronger seasonality pic.twitter.com/c0rwpZURrb
— Mike Zaccardi, CFA, CMT (@MikeZaccardi) July 30, 2022
The Nasdaq Composite was up 12.3% in July, one of the best months for the index in history. Here's a look at forward returns following the strongest monthly gains in the past… pic.twitter.com/F71tor1IMk
— Charlie Bilello (@charliebilello) July 30, 2022
$SPX closed above its 100 day MA too but notice that it's a common thing this year and happened at the February and March highs too. The next resistance is at the June high at 4178 and it looks like it may get there on Monday or Tuesday when the next short term high is due. pic.twitter.com/iwdOEBmEgR
— CyclesFan (@CyclesFan) July 29, 2022
SP500 – It's doing exactly what I predicted 6 weeks ago on June 18th when everyone was super bearish at 3600 and the exact day it bottomed. 4200ish will be a massive point of resistance confluency and a major reversal zone for the next leg lower.. pic.twitter.com/5G9o4Uim61
— Michael Byrdy (@michaelbyrdy) July 31, 2022
$SPX declined for 23 weeks from the January high to the June low. The 2nd leg down from the March high to the June low lasted 11 weeks. I'm expecting a symmetrical 11 week rally from the June low into an end of August high. It's likely to reach the 62% retracement at 4255. pic.twitter.com/ZWUoZh80pR
— CyclesFan (@CyclesFan) July 30, 2022
$QQQ
So far so good in the 13 year channel that hasn’t broke yet pic.twitter.com/6zG6ZnQ2LB— Bracco⚡️ (@Braczyy) July 30, 2022
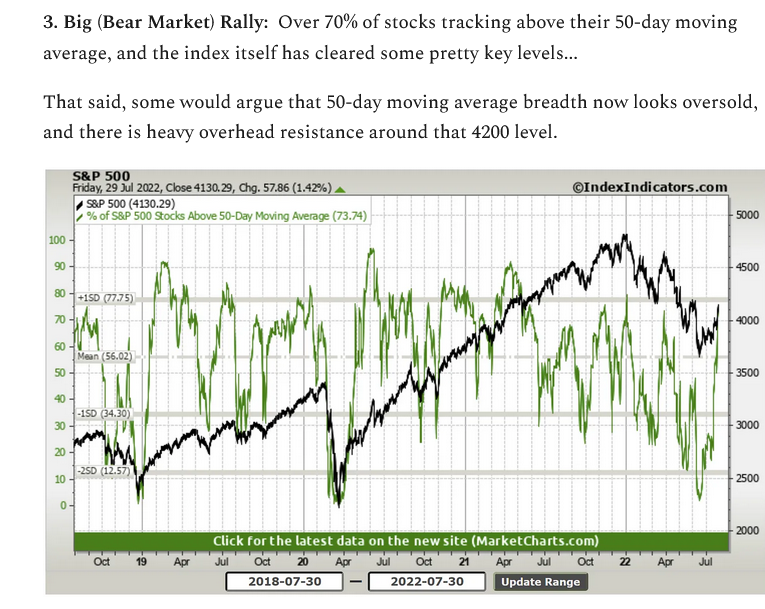
Update: The percent of $SPX above their 50 day MA's has surged to 76.8% now after the low reading near 2% in mid June at the lows. Near 1 year highs and consistent with other breadth thrust improvement signals. How fast prices can change when humans are involved.. pic.twitter.com/V2Md0AKlap
— Jason (@3PeaksTrading) July 29, 2022
The top performing month of July for the S&P 500 is July of 1989's gain of 8.84%.
We're currently up >9%.
Everyone saw it all coming, obviously, but I don't remember any calls for the greatest July in the S&P 500's history on 6/30.
— Steve Deppe, CMT (@SJD10304) July 29, 2022
$SPY +9.22% (total return) for the month, best since Nov 2020 pic.twitter.com/9m3LJfvjBy
— Mike Zaccardi, CFA, CMT (@MikeZaccardi) July 29, 2022
Very good week for bulls. Looks very similar to March at this point. Next couple weeks are important. $SPX $SPY pic.twitter.com/QafCSmPKPp
— Jim Denholm, CMT (@denholm_jim) July 29, 2022
$SPY
Weekly volume analysisClosed the week right at our supply shelf above between 412-422
Major volume gaps labeled with the blue zones. Notice how much larger and volatile the candles are in the gaps
Expecting some consolidation at the supply zone for now pic.twitter.com/s774LOqWgv
— Bracco⚡️ (@Braczyy) July 29, 2022
$SPY
Haven’t seen many ppl draw this trend line. Found it a few months ago when we first tapped itI think we can test this trend line again here soon. Crazy how relevant it’s been since 2018. Major pivot point highlighted with green circles pic.twitter.com/9eylSJrtTw
— Bracco⚡️ (@Braczyy) July 29, 2022
If you need another proof why a top is imminent take a look at the $SPX McClellan Oscillator which closed at 100. There were only 2 higher closes this year: on March 29 at 109 and on May 27 at 114. pic.twitter.com/OmN2DTMvbq
— CyclesFan (@CyclesFan) July 29, 2022
Notes: 1) % of stocks >50dma is an objective measure of panic selling; 2) readings <10% usually flag durable bottoms; 3) failed signals produce tradable bounces; 4) June's reading is constructive, but not conclusive; 5) >85% thrust is likely to confirm the next durable advance.
— Mark Ungewitter (@mark_ungewitter) July 29, 2022
Two breadth thrust signals with Thursday’s rally. 10-day advances/10-day declines rose above 1.9 for first time since Feb 2021. @NDR_Research 1/2 pic.twitter.com/pHfBDwhtNw
— Ed Clissold (@edclissold) July 29, 2022
Percent of $SPX stocks at 20-day new highs rose above 55% for first time since June 2020 (concept thanks to Jeff DeGraaf). This marks the 3rd breadth thrust signal in the last 8 trading sessions. Broader than off the March and May lows. @WillieDelwiche @RenMacLLC pic.twitter.com/ofhLRPyyv8
— Ed Clissold (@edclissold) July 29, 2022
Previous instances over past 40+ years when % of $SPX stocks at 20-day highs exceeded 55%.
Nothing's certain (see 2002), but odds of further upside seem to be improving. pic.twitter.com/izY4kt5Scu
— Willie Delwiche, CMT, CFA (@WillieDelwiche) July 29, 2022
Still more new lows than new highs on NYSE & NASDAQ, but looks like we may have gotten an SPX-based breadth thrust today.
— Willie Delwiche, CMT, CFA (@WillieDelwiche) July 28, 2022
🇺🇸 Earnings
Morgan Stanley expects S&P 500 earnings per share of $225 in 2022 and $236 in 2023
👉 https://t.co/3SVJ18RESnh/t @MorganStanley #markets #investing #earnings #EPS#sp500 $spx #spx $spy #stocks #stockmarket #equities pic.twitter.com/2dmh5gvWIj
— ISABELNET (@ISABELNET_SA) July 30, 2022