1-week S&P 500 heat map. Are my colors inverted?? $XLEhttps://t.co/uWWC481Pia pic.twitter.com/dJE0iVJYcM
— Mike Zaccardi, CFA, CMT (@MikeZaccardi) June 25, 2022


#SP500 Breadth & Momentum:
% of SP500 stocks:
above 200-day SMA: 22%🔴
above 50-day SMA: 22% 🔴
above 20-day SMA: 35% 🔴 pic.twitter.com/TPIEHn4prk— My Weekly Stock (@MyWeeklyStock) June 26, 2022
Based on a linear line from pre pandemic times, the market has corrected to "nominal".
But times are not nominal. High inflation, supply chain woes, and a war in Europe.
The S&P 500 P/E/ ratio slid as low as 15.5 after the subprime housing crisis, and today it sits at 19.7. pic.twitter.com/9ZJ1nO1f0a
— Silicon Strategies (@siliconstrat) June 26, 2022
— Hopes, Dreams, and the S&P 500: A Rude Awakening
Stock valuations have three components.
First is the actual book value: capital, inventory, and all that. pic.twitter.com/kI68hCIDMh
— Johannes Urpelainen (@jurpelai) June 26, 2022
Worst performing S&P 500 stocks so far in 2022
Netflix $NFLX -68.3%$ETSY -61.8%
Align $ALGN -60.6%
PayPal $PYPL -58.8%
Bath & Body $BBWI -55.7%
Under Armour $UA -53.5%
Caesars $CZR -52.5%$EPAM -51.2%
Ceridian $CDAY -50.6%
Facebook $META -49.4%
Illumina $ILMN -49%$ZBRA -48.1%— Markets Today (@marketsday) June 26, 2022
Highest amount of average BEARS since 2009…
Lowest amount of average BULLS since 1990…
The trend has been in place since April 2021… nothing new$SPY $SPX #stocks #sentiment pic.twitter.com/SqqPTIsluK
— Grant Hawkridge (@granthawkridge) June 26, 2022
$SPX is expected to report Y/Y revenue growth of 10.2% for Q2 2022, which would be the 6th straight quarter of double-digit growth. #earnings, #earningsinsight, https://t.co/E0Z6YRUPfe pic.twitter.com/mlRIDAuhh1
— FactSet (@FactSet) June 25, 2022
$SPX The Big Boyz were buying this week as evidenced by the upswing in Advancing Volume, $NYUD. Crossing above the 50d MA is a sign this rally may have legs. No guarantees. pic.twitter.com/1Nlz1ug9V9
— Alan Cohen (@al_xdpg) June 26, 2022
$SPX A closer look, daily chart, shows that as long as we stay above the 50d MA (stay green) this rally will run. New highs? Who cares. $NYUD indicates Big Money is moving into this market. Stay on your toes. pic.twitter.com/FpZEVxqupr
— Alan Cohen (@al_xdpg) June 26, 2022
Is our long secular bull dead? Here's a way to gauge recovery (or failure to recover): Separate all cyclical bear markets into two categories: ones for which the 36-month Z-score (de-trended cycle) remains positive, and the ones for which they get more negative. 🧵 pic.twitter.com/VP36KVwtYB
— Jurrien Timmer (@TimmerFidelity) June 25, 2022
Market breadth suggests that earnings estimates may see more downgrades than upgrades in the coming months. The chart below shows the percentage of stocks above their 200-day moving average plotted against the revisions index (upgrades as a % of all revisions) h/t @macrobond 🧵 pic.twitter.com/JfGjL2gneF
— Jurrien Timmer (@TimmerFidelity) June 23, 2022
15% of SPX stocks > 200dma pic.twitter.com/nZbM9Ic6hT
— Mike Zaccardi, CFA, CMT (@MikeZaccardi) June 24, 2022
We're heading for Wave '3' everything. pic.twitter.com/lu7xp5qFIF
— Mac10 (@SuburbanDrone) June 24, 2022

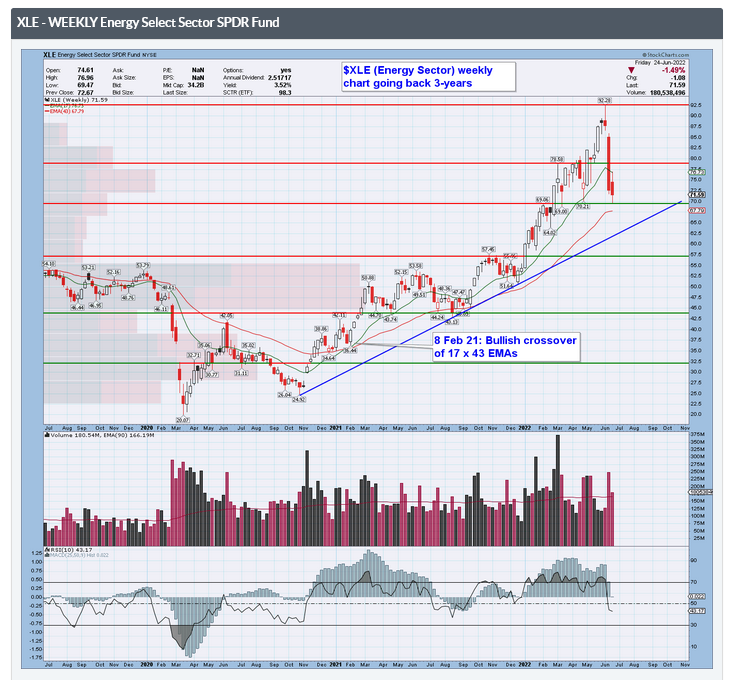
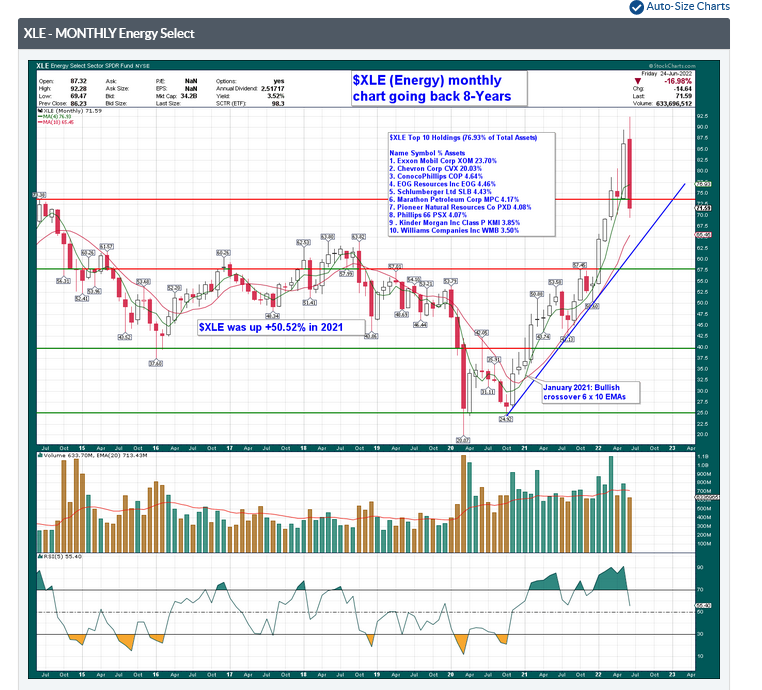
Energy equities are only back to early-2020 levels relative to the market despite 24-month forward oil prices 2x higher and generating cash flow that is 3x higher than back then (and 8x higher for E&Ps) $XLE $USO $XOP pic.twitter.com/hgoETMbQKo
— Mike M. Mustafoglu (@TransEnergy) June 24, 2022
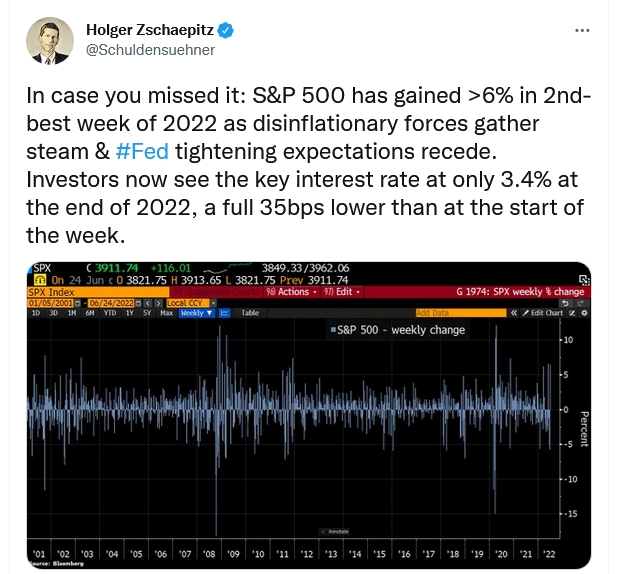
S&P 500 may have another 24% to fall to 2,900 points, 150yrs of market history shows, acc to SG. SG studied post-crisis market valuations starting in the 1870s, using quantitative analysis, as opposed to factors such as earnings projections and valuations. https://t.co/l2G8JqNUzi
— Holger Zschaepitz (@Schuldensuehner) June 24, 2022
YTD investors have bought $195bn of stocks and sold $193bn of bonds;
‘22 “capitulation” has been in bonds, not stocks pic.twitter.com/iuz3AAFXm8
— Mike Zaccardi, CFA, CMT (@MikeZaccardi) June 24, 2022
Stocks have not priced in the earnings decline that is likely coming. pic.twitter.com/ZBK3GcovYT
— Lance Roberts (@LanceRoberts) June 23, 2022
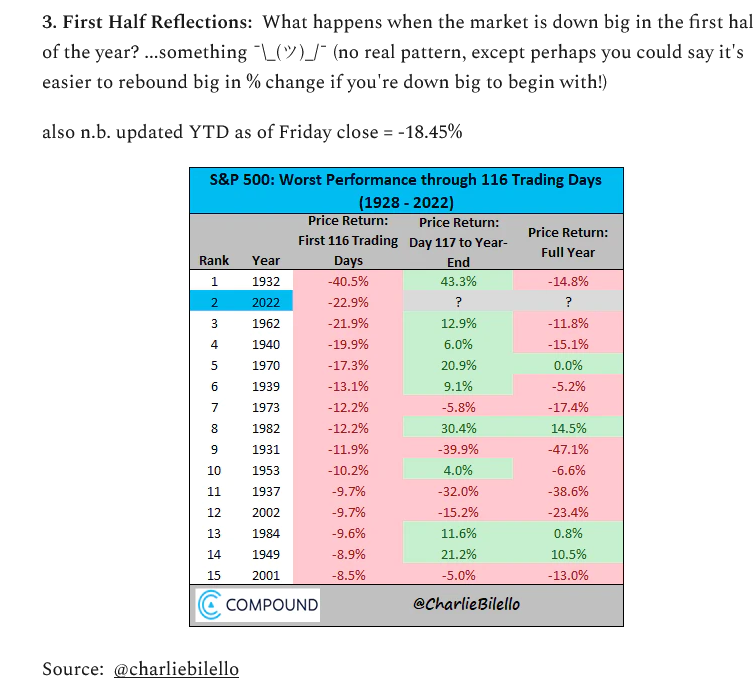
2022 could be one of the worst years ever for the S&P 500 at the half way point of the year.
That's the bad news, but the good news is previous worst first halves saw some nice snapbacks. pic.twitter.com/xOPvno0MHM
— Ryan Detrick, CMT (@RyanDetrick) June 22, 2022
The SPX has had rallies over the years that get interrupted by sizeable corrections,
but the SPX has trended higher over time, especially after bullish breakouts in 1950, 1950, 1980 and 2013 pic.twitter.com/dyUKo5JGUO
— Mike Zaccardi, CFA, CMT (@MikeZaccardi) June 22, 2022
The history of US bear markets pic.twitter.com/J2r33sBKox
— zerohedge (@zerohedge) June 19, 2022
Energy Sector Bullish Percent Index Is The Lowest Since Oct 2020 $XLE https://t.co/uWWC481Pia pic.twitter.com/b5SnU4cKqo
— Mike Zaccardi, CFA, CMT (@MikeZaccardi) June 20, 2022
FWIW: Got to put this one on the bullish side of the "Weight of the Evidence" ledger… #sentimentrader https://t.co/TROMf69r39 pic.twitter.com/IgZe5vhNAx
— Jay Kaeppel (@jaykaeppel) June 20, 2022
Healthcare with some relative strength revival in the last few weeks. $XLV $TEVA https://t.co/v4Il0HHiWl pic.twitter.com/kLBRVVaTQz
— Mike Zaccardi, CFA, CMT (@MikeZaccardi) June 20, 2022
“Global Equities — 1970s Inflation” pic.twitter.com/l38SDH1HRG
— Shai Dardashti (@ShaiDardashti) June 20, 2022
Luethold Group:
Worse and Worst Case Scenarios based on valuations.
This is why using valuation as a guide for capital allocation proves ineffective.
Probability of Worst-case is 12%, unless Worse-case is achieved, which carries a 35% probability presently. $SPY $QQQ $NYA pic.twitter.com/ln3v9eVJG6
— Seth Golden (@SethCL) June 20, 2022
BofA Fund Mgr Survey Indicates SPX 3500 Fed 'Put' – 3500 is a 50% Fibonacci level Mar '20 low to Jan '22 peak, now a peak in Puts at 3500. @spotgamma @jam_croissant @AnnTrades @johnauthers @Mayhem4Markets #TRADINGTIPS #trading #ES_F #SPX500 #SPY #OptionsTrading #Options pic.twitter.com/CxEJkQGo0l
— Patrick Hill (@PatrickHill1677) June 20, 2022
As of June 17, 2022, the S&P500 P/E ratio is 38% higher than its modern era average. By this valuation, the market is Overvalued.#SPX500 #spx $spx $spy pic.twitter.com/hXrxQ27tGI
— Rosanna 🐳 💫 (@RosannaTrades) June 19, 2022
Every mega-cap Tech stock is down at least 25% YTD as we approach the halfway point of 2022. pic.twitter.com/bAdTp1N4gZ
— Bespoke (@bespokeinvest) June 20, 2022
Energy stocks finally experienced what the rest of the market has been feeling with massive declines last week into oversold territory. Most names quickly gave up more than half of their YTD gains. #XLE pic.twitter.com/JxjtaLrGrX
— Bespoke (@bespokeinvest) June 20, 2022
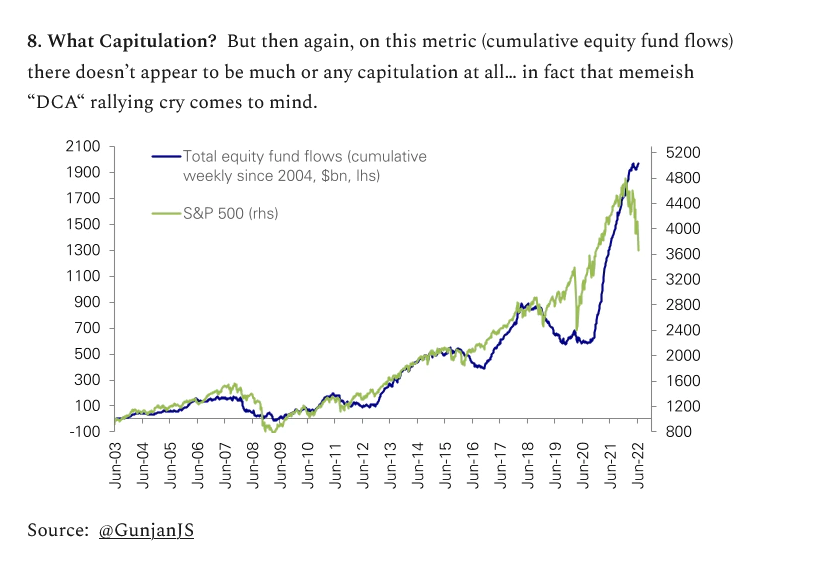
"Despite the large market correction, flows into equity funds (ETFs and mutual funds) have been robust (cumulative $210bn year to date or 1.2% of AUM)." – DB pic.twitter.com/ICuOe7UnnL
— Sam Ro 📈 (@SamRo) June 21, 2022
The VIX index has yet to break 40 this year despite the S&P 500 going into a bear market, signalling there hasn’t been the kind of market distress seen during the covid crash or the China slowdown in 2015. Will there be more panicked selling to come? #stocks #equities pic.twitter.com/j96Sj0GpIl
— Michael A. Gayed, CFA (@leadlagreport) June 21, 2022
Oppenheimer Market Bottom Checklist Update$SPX $SPY $NYA $QQQ pic.twitter.com/nJoSGVKSaI
— Seth Golden (@SethCL) June 20, 2022
Had VERY similar pattern during correction phase of the 2007-08 bear market. You know what else we didn't have in early 2008 during that correction? $VIX capitulation above 115-125% of VIX3M – VERY similar to this correction phase of what could ultimately turn into a bear market https://t.co/s3hq6CuIAS pic.twitter.com/cpJadoGk0W
— David Settle, CMT (@davidsettle42) June 20, 2022
Courtesy of @PhillipsRelic —
Higher quality version of original photo, below: pic.twitter.com/Gzy2i8LRlV
— Shai Dardashti (@ShaiDardashti) June 20, 2022
The % of S&P500 members above their 200 day moving average is now ~12.5%, close to levels that marked previous market bottoms. Not saying we are there, but the odds are stacking up. pic.twitter.com/rPvSaNBFFe
— Sean Ashton (@SashtonSean) June 21, 2022
CEOs, economists, and investors talking a lot about #recession in recent days. Investors adding significant shorts to the S&P 500, Nasdaq, and Euro Stoxx.
It is when everyone gets bearish that you have to pay attention. Lots to worry about, but sentiment matters. pic.twitter.com/MXih4RWSom
— jeroen blokland (@jsblokland) June 21, 2022
Value vs Growth steady last 6 weeks. $VTV $VUG pic.twitter.com/IEyjx0emVO
— Mike Zaccardi, CFA, CMT (@MikeZaccardi) June 20, 2022
🇺🇸 Equities
Leveraged funds and asset managers are net short US equity futures. How far will the US stock market decline go?
👉 https://t.co/Lec7q10LT3h/t @SoberLook #markets #investing #equities #futures#sp500 $spx #spx $spy #stocks #assetallocation #stockmarket pic.twitter.com/1sTUMiIaZI
— ISABELNET (@ISABELNET_SA) June 21, 2022
Sentiment: AAII Net Bullish Sentiment VS S&P500. Lower than March Covid indiscriminated selling, 2018 'taper tantrum', 2015 correction … and as almost as low as 2008 Lehman/GFC #equities #stocks $SPY #FED pic.twitter.com/lMYriPPTon
— Maverick Equity Research 🇺🇦✌️🇺🇦 (@MaverickBogdan) June 21, 2022
📌 Sentiment
The GS sentiment indicator remains negative
👉 https://t.co/jJ1iAXzd0Yh/t GS #markets #sentiment #sp500 $spx #spx $spy#equities #stockmarket #investing #assetallocation pic.twitter.com/hzUzEn4SYP
— ISABELNET (@ISABELNET_SA) June 21, 2022
bear market rallies happen…typically offer 7-8% over a couple weeks.
fast and furious and if your core view is bearish/short its nice to avoid them if possible. pic.twitter.com/cA2QhUkNLZ— MrBlonde (@MrBlonde_macro) June 21, 2022
Sizing up the bear: Below we see market breadth, in the form of new 52-week highs minus new lows. At -48%, this is consistent with typical bear markets, but it falls well short of the kind of once-in-a-career “nothing-to-lose” signals produced in 2020 and 2009. pic.twitter.com/LqIZ2RD4Dv
— Jurrien Timmer (@TimmerFidelity) June 21, 2022